

As a professor of Epidemiology, my primary goal is to teach my students how to read, critically analyze, and apply the results of an epidemiological study to create healthy communities. I want to empower my students to read research papers from beginning to end (not just the Abstract and definitely not skipping the Methods section). I want them to confidently read the literature, determine for themselves the strengths and limitations of the study, and be able to communicate the findings and any applications of those findings to a group of community members without any knowledge of epidemiology.
And I want to invite all of you into my classroom (so to speak). I want to provide you with a guide to reading the epidemiological research and the opportunity to read, discuss, and apply the findings of epidemiological studies with me.
Together — with improved literacy and the ability to see the strengths and limitations that are inherent in every study — we can fight misinformation, spot disinformation, craft strategies to improve health, and create healthy communities.
Are you ready?
Do you want to learn how to read, analyze, and apply the epidemiological literature?
Let’s get started… (if you missed one of the previous posts, start here — Rule #1).

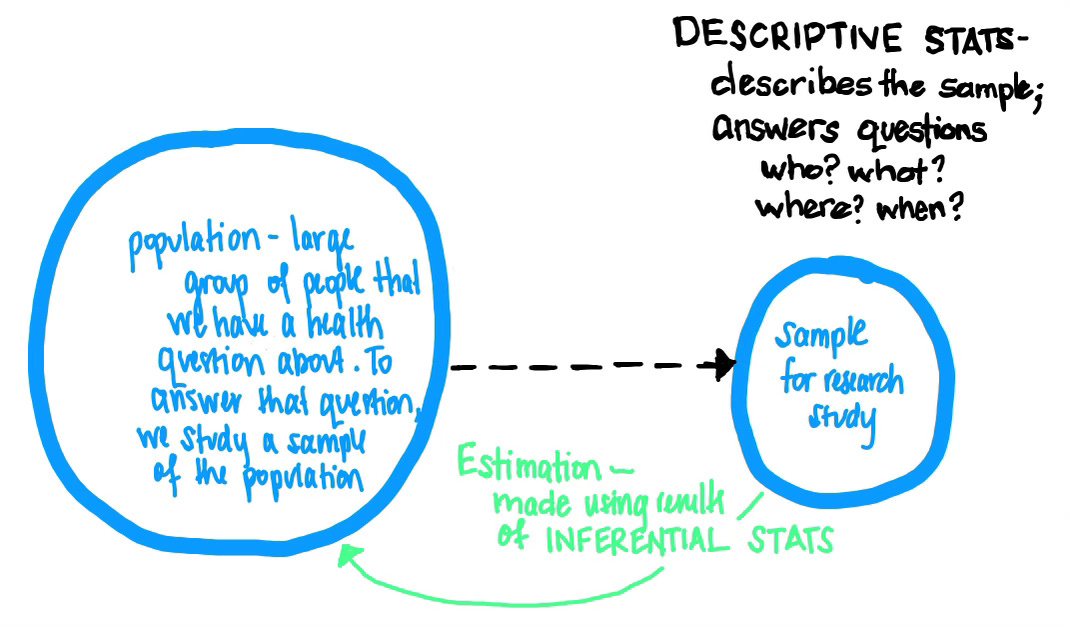
Biostatistics is the art and science of collecting, organizing, describing, and analyzing data in epidemiology. In most epidemiological studies, we study a sample—a subset of a larger population—and use both descriptive and inferential biostatistical methods to make generalizations about the larger population (known as our source/target population).
Descriptive statistics describe the important features and trends in a data sample and allow us to decide whether or not it is representative of the population. Inferential statistics are used to investigate the research hypothesis about the population, using information from the sample. We use the results from the sample analyses to make inferences, conclusions, or generalizations about the population from which the sample was selected.
Often on the first Epidemiology Exam of the semester, I ask my students the following question —
True or False — We use Biostatistical tools/procedures – think: regression, t-test, chi-square, etc... -- to prove causality between a health outcome and a risk factor.
While the tools and procedures of biostatics are used to look at the relationship(s) between health outcomes (a disease, illness, or injury) and potential risk factors (exposure to a virus, access to healthcare services, inhalation of cigarette smoke), statistics canNOT prove anything.
So the statement above is incorrect/false.
We use statistics to determine if something is happening by chance (as in I am so lucky that I won the lottery; I had the 1 in a million ticket) or if there is really something going on (as in it is not by chance alone that so many individuals who smoke cigarettes develop lung cancer; there must be an association between cigarette smoke and development of lung cancer).
Remember — the authors of the epidemiological literature assume you know that association does NOT mean causation. According to renowned epidemiologist Dr. Kenneth Rothman, in epidemiology, we collect data and use statistical analyses to —
“Identify an event, condition, or characteristic that plays an essential role in producing an occurrence of disease.”
DETERMINING STATISTICAL SIGNIFICANCE
Using inferential statistical techniques, we can determine if a disease and a risk factor are truly associated with one another OR if they are happening at the same time, among the same people, and at the sample place by chance along with two methods:
Confidence intervals
p-value
In order to determine if there is an association between a disease and a risk factor, we can quantify the strength of the association by constructing confidence intervals. Confidence intervals (CI) estimate the range/interval we believe the value of the association between a disease and risk factor will take on. For example, imagine we pulled a sample of 1000 people from a large population and conducted a study to determine if there is an association between smoking cigarettes and the development of lung cancer. In our sample, we find that the risk of lung cancer is 20 times higher for individuals who smoke cigarettes compared to those who do not smoke cigarettes. We can take that 20 times number from the sample, and calculate a confidence interval (let’s say, a 95% confidence interval, because those are the most common). We can use this interval to estimate the risk of lung cancer among those who smoke cigarettes in the larger population (the strength of the association between smoking and lung cancer). If the interval ranges from 15-30, we would say —
Based on our sample data, we are 95% confident that in the population the risk of lung cancer is between 15-30 times higher for individuals who smoke cigarettes compared to those who do not smoke cigarettes.
Calculating a confidence interval allows us to quantify (give a numerical value to) our estimation (the green arrow in the illustration above).
A p-value is another measure that we can use to determine if there is statistical significance between a disease and a risk factor. A p-value is defined as the probability of obtaining a result at least as extreme as that observed in the study by chance alone. In other words, a p-value is the probability/likelihood (or a %) that the disease and risk factor are connected by chance alone. In the example above, if we calculated a p-value looking at the relationship between smoking cigarettes and the development of lung cancer, it might be 0.01 or 1%. We would say that the probability of all those individuals who smoke cigarettes developing lung cancer by chance alone is 1% (very small — something, like cigarettes, is likely leading to lung cancer).
NOTE — many of us have been taught that a p-value less than 0.05 is good. If you were taught this, you must UNLEARN this. P-values are neither good nor bad. They just are. They allow us to see the likelihood of something occurring by chance alone. Do not attach goodness or badness to a p-value. It is just a probability. That’s it. Do NOT make it more than it is. There is no good p-value or bad p-value. Just p-values.
In most epidemiological studies, the statistical analysis section of the paper will begin with descriptive statistics where the authors look to see if the disease is associated with any of the potential risk factors — and by associated we mean that they are NOT connected by chance alone (in this case, the author will be looking for small p-values; where the probability of the disease and risk factor occurring together by chance alone is small). P-values are calculated using statistical tests.
Determining which statistical test to use (and under which conditions a test is appropriate) requires taking a statistics class —
Let me know if you are interested in one… Summer school anyone? Online course?
When working your way through the statistical analyses of any study, here are the three things to remember —
Statistics canNOT prove anything.
They can only help you determine how likely it is that something could happen (that a risk factor could be associated with disease occurrence).There is no such thing as a good p-value or a bad p-values.
P-values provide us with information, specifically the likelihood of things happening by chance alone. They provide information; they are neither good nor bad.A good statistics class is worth its weight in gold. While one can navigate through the epidemiological literature without a background in statistics, taking a statistics class and understanding the basics (and being able to apply them) makes you unstoppable. If you don’t have it in you to take a statistics class, I highly recommend making nice with a friendly statistician (like me!) — we can help you navigate the messy and complicated results section of any epidemiology paper.

What statistics questions do you have? Need to see an example? Want to walk through the statistics of a specific paper together? Please let me know —
That’s it… you now know the basics of biostatistics.
Next Tuesday we’ll move on to What to Expect in the Results Section…
Be sure you are subscribed so you do not miss a thing.
Epi(demiology) Matters is written by Dr. Becky Dawson, PhD MPH — an epidemiologist, teacher, mom, wife, and dedicated yogi. She is a tenured professor at Allegheny College, Research Director at a community hospital, and an exclusive contributor (all things health & medicine) at Erie News Now (NBC/CBS). Her goal is to create healthy communities for all. She writes Epi Matters — first & foremost because epidemiology does matter (to all of us) and she hopes that each post will help to educate and empower readers to be healthy and create healthy communities.
Be sure you and your friends and family are subscribed so you don’t miss a post —
Epi(demiology) Matters is free — because science, reports, news, updates, and alerts about health should NOT be behind a paywall. EVER. Everyone needs access to up-to-date health information in order to be healthy and create healthy communities for all.